Kyubit BI
Enterprise BI tool
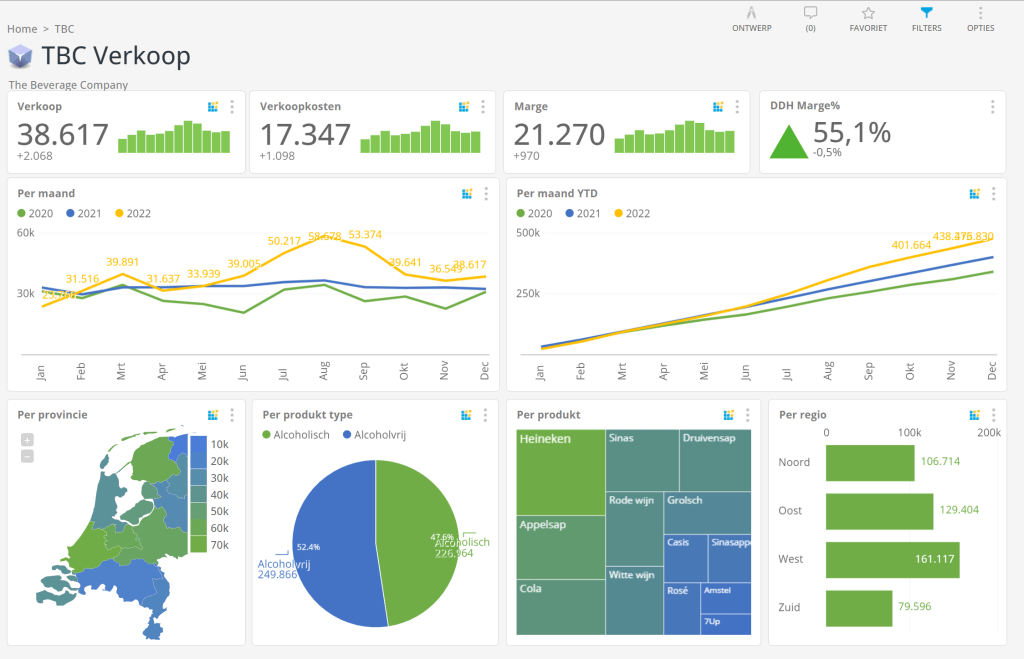
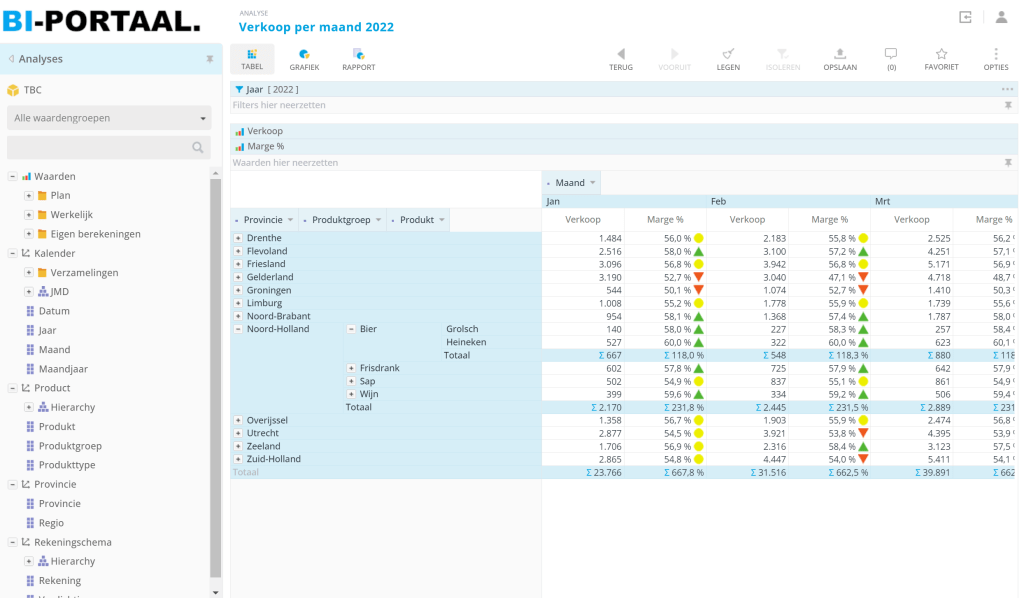
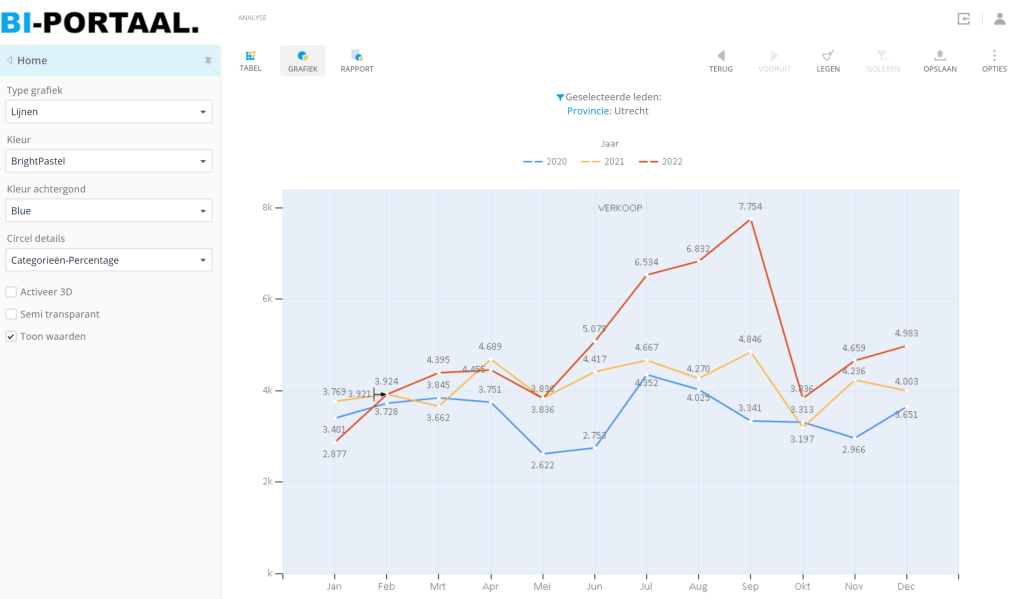
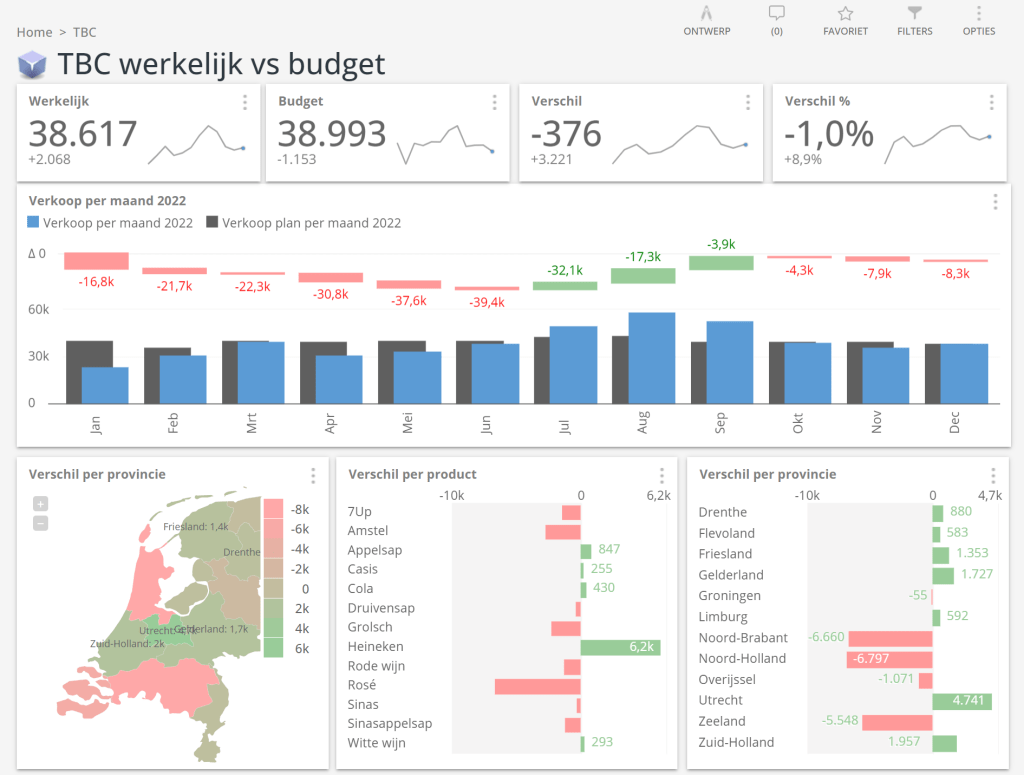
Kyubit BI offers many advantages over other BI tools that make it a suitable option for organization-wide deployment. For example, you can create different tenants for the different departments and groups, you can personalize the tool with the white-label option, it is easy to roll out on a large scale for a low amount per user and different source systems can be combined in one interactive dashboard . In addition, Kyubit BI can be integrated into the website, portal or your own application. End users can create reports and dashboards themselves, share them with others and automatically send emails. In addition, Kyubit BI is extremely user-friendly: users can easily and quickly, intuitively navigate through their data to find answers to questions.
- From € 1 per user per month
- Choose the structure and layout of your dashboards yourself
- Various licensing options, including white label
- Suitable for large-scale deployment, both inside and outside your organization
- Users do not have to install anything: everything is possible via web browser
- Authorization based on AD or custom login
- Combination of ad-hoc analysis and interactive dashboard
- Used and supported worldwide

Do you have a question about the BI options in your organization?
Leave your details via the button below. Prefer direct contact? Chat or App with us via the Chatbot bottom right of your screen.
Your BI trajectory
BI-Xperts can provide support throughout the entire implementation process
and the rollout of BI in your organization, or support it
in one or more specific knowledge areas.
Introduction and inventory of information needs, your organization and the desired design.
Mapping your current IT infrastructure and accessing the most important data sources.
Setting up your DWH, building data models, adding your business logic and security.
Development of dashboards and reports, training of users and support of your organization.
What do our customers say

Our other services
BI-Xperts specializes in offering the following
services, solutions and products.

Power BI
Beautiful and interactive Power BI dashboards and reports for your organization.
Watch Demo
or

Scheduling/Budget
Plan and budget yourself, and analyze the data directly next to your realized figures.
Watch Demo
or

Data Experts
MS SQL Server experts: data access, data warehousing, ETL, data science, Tabular and OLAP.

BI Portal
A starting point for your planning, reports and dashboards. For all users in your organization.
- + 31 (0) 85 0410212
- info@bi-xperts.nl
-
Merwedekade 8
4131 NZ Vianen Netherlands

